
Performance Profiling
This page covers a few tools for finding out where the time goes when you use pymmcore-plus. Every device behaves differently, so slowdowns depend a lot on your hardware and on what you're doing with it: measure on your own setup.
If you just want a quick look at how long common core and device calls take
with your hardware, mmcore bench runs a short benchmark (with the demo
configuration, or your own with --config my.cfg) and prints a table of timings.
Profiling with py-spy
There are many tools available for profiling Python code. We recommend starting
with py-spy. You can add it to your
environment with pip install py-spy. For complete usage tips, see the
py-spy readme,
but here is a quick example of how to use it with pymmcore-plus:
Example with python script
Create a Python script that uses pymmcore-plus to perform some operations, such
as instantiating a CMMCorePlus object, loading a configuration, and performing
some task such as running a multi-dimensional acquisition. Save this script
somewhere (we'll call it example.py) and profile it with py-spy:
Note: on macOS, py-spy requires sudo access
- the
-o profile.jsonflag specifies the output file name - the
-f speedscopeflag specifies the output format. Here, we use thespeedscopeformat, which can be viewed in the Speedscope web viewer. - the
-r 1000flag specifies the sampling rate (in Hz). The default is 100 Hz, so if you want more detailed profiling, you can increase this number as we've done here. - the
--separates thepy-spyarguments from the Python script to be profiled
Example using mmcore run
If you are profiling a standard MDASequence acquisition, you can use the mmcore run
command line tool to run the acquisition and profile it with py-spy. First, create
a json/yaml file representing the MDASequence acquisition you want to run:
from useq import MDASequence

seq = MDASequence(
    channels=["DAPI", {"config": "FITC", "exposure": 1}],
    time_plan={"interval": 2, "loops": 5},
    z_plan={"range": 4, "step": 0.5},
    axis_order="tpcz",
)
seq_json = seq.model_dump_json(exclude_unset=True)

with open("mda_seq.json", "w") as f:
    f.write(seq_json)
Then, run the acquisition with mmcore run and profile it with py-spy:
sudo py-spy record -o profile.json -f speedscope -r 1000 -- mmcore run mda_seq.json --config your_mm_config.cfg
- the
-o,-f,-r, and--flags are the same as in the previous example - the
mmcore runcommand runs the acquisition specified in the json file (it doesn't save any data) - the
--configflag specifies the path to the MMCore configuration file defining your microscope.
Example attaching to a running process
If you have a running Python process that you want to profile, you can attach
py-spy to it using the -p flag:
Analyzing the profile
Once you have a profile, you can view it in the Speedscope web viewer.
Open https://www.speedscope.app/ and drag the profile file into the window.
See the Speedscope documentation for more information. The "Sandwich" view is particularly useful for identifying slow functions and hot paths in your code:
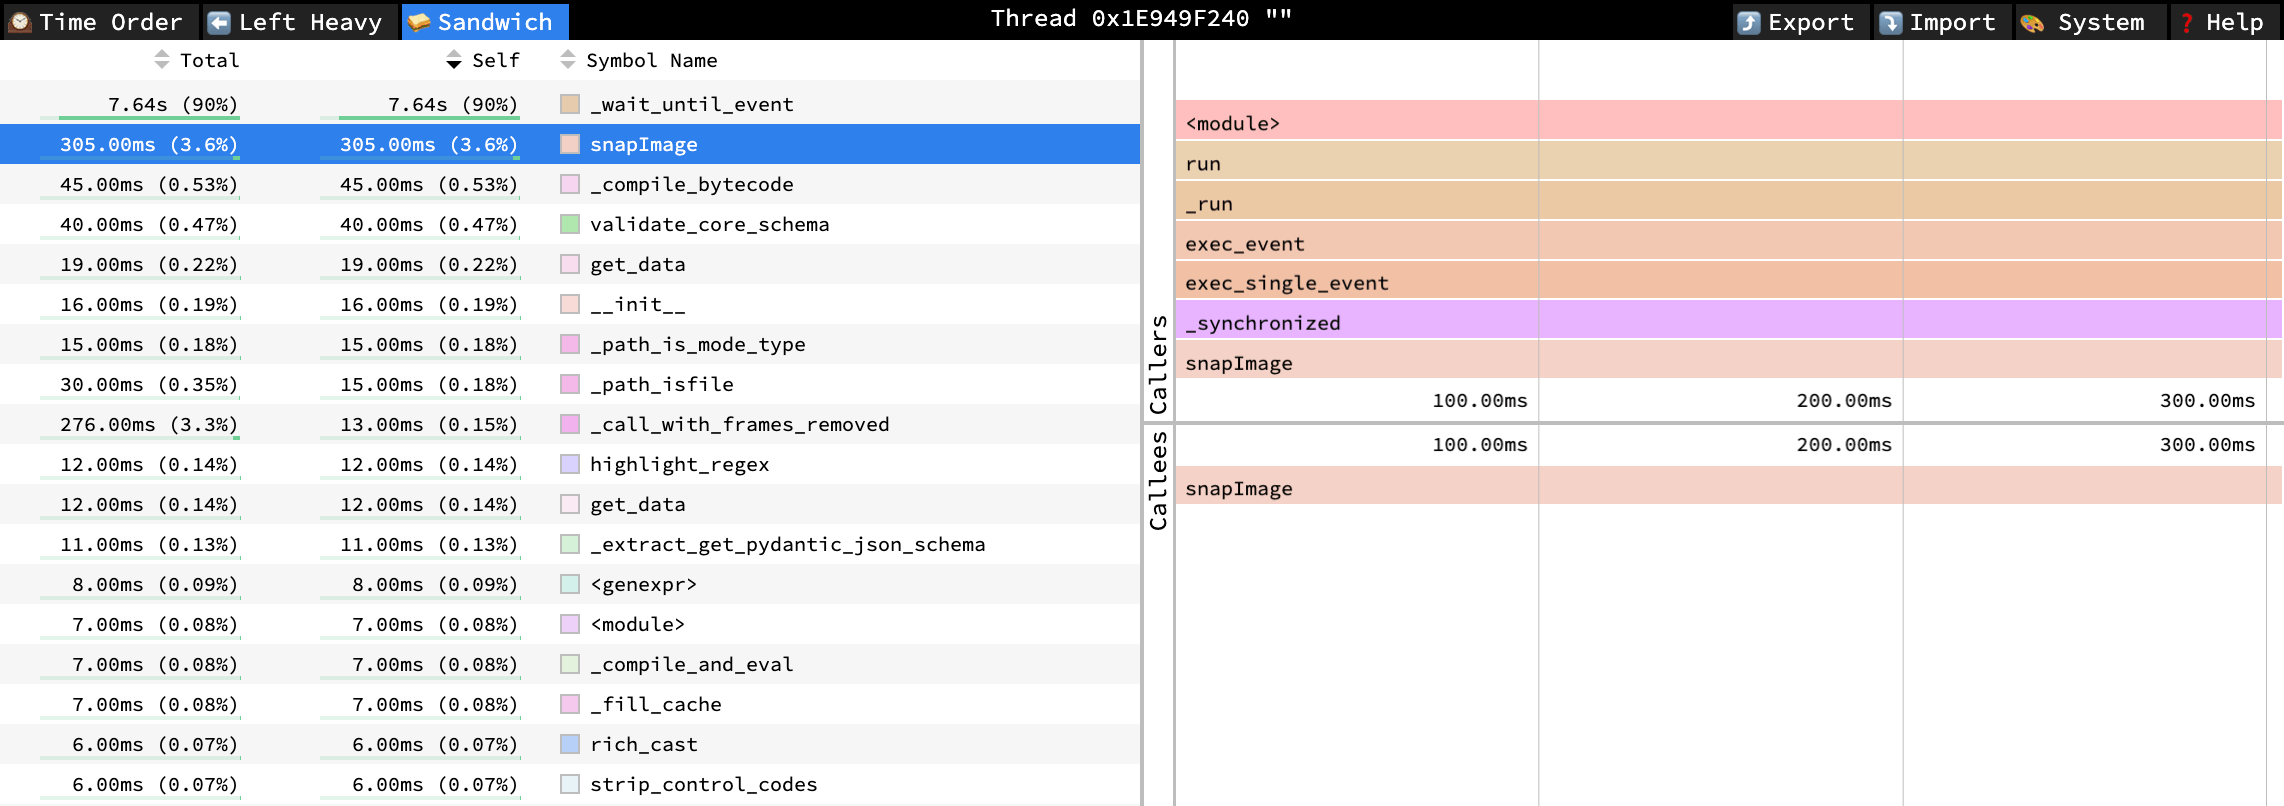
Feel free to open an issue with your profile.json file if you need help
interpreting the results.